
One City, Many Birthdays: Calgary’s Growth in a Map
Calgary’s housing history stretches from an average year built of 1915 in Mission to 2025 in Hotchkiss. Put those numbers on a map, and more than a century of growth becomes visible—community by community.
That’s what I wanted this map to show. The names tell you where you are. The years help explain how that part of Calgary fits into the city’s story.
Calgary’s birthday as a city is January 1, 1894, when its city charter came into effect. It had already become a town on November 7, 1884, following the establishment of the fort in 1875. The land’s Indigenous history extends far beyond those municipal dates. City of Calgary Archives
But a city doesn’t arrive fully built on its birthday. Calgary has spent the generations since adding streets, homes and entire communities—and changing the ones already here.
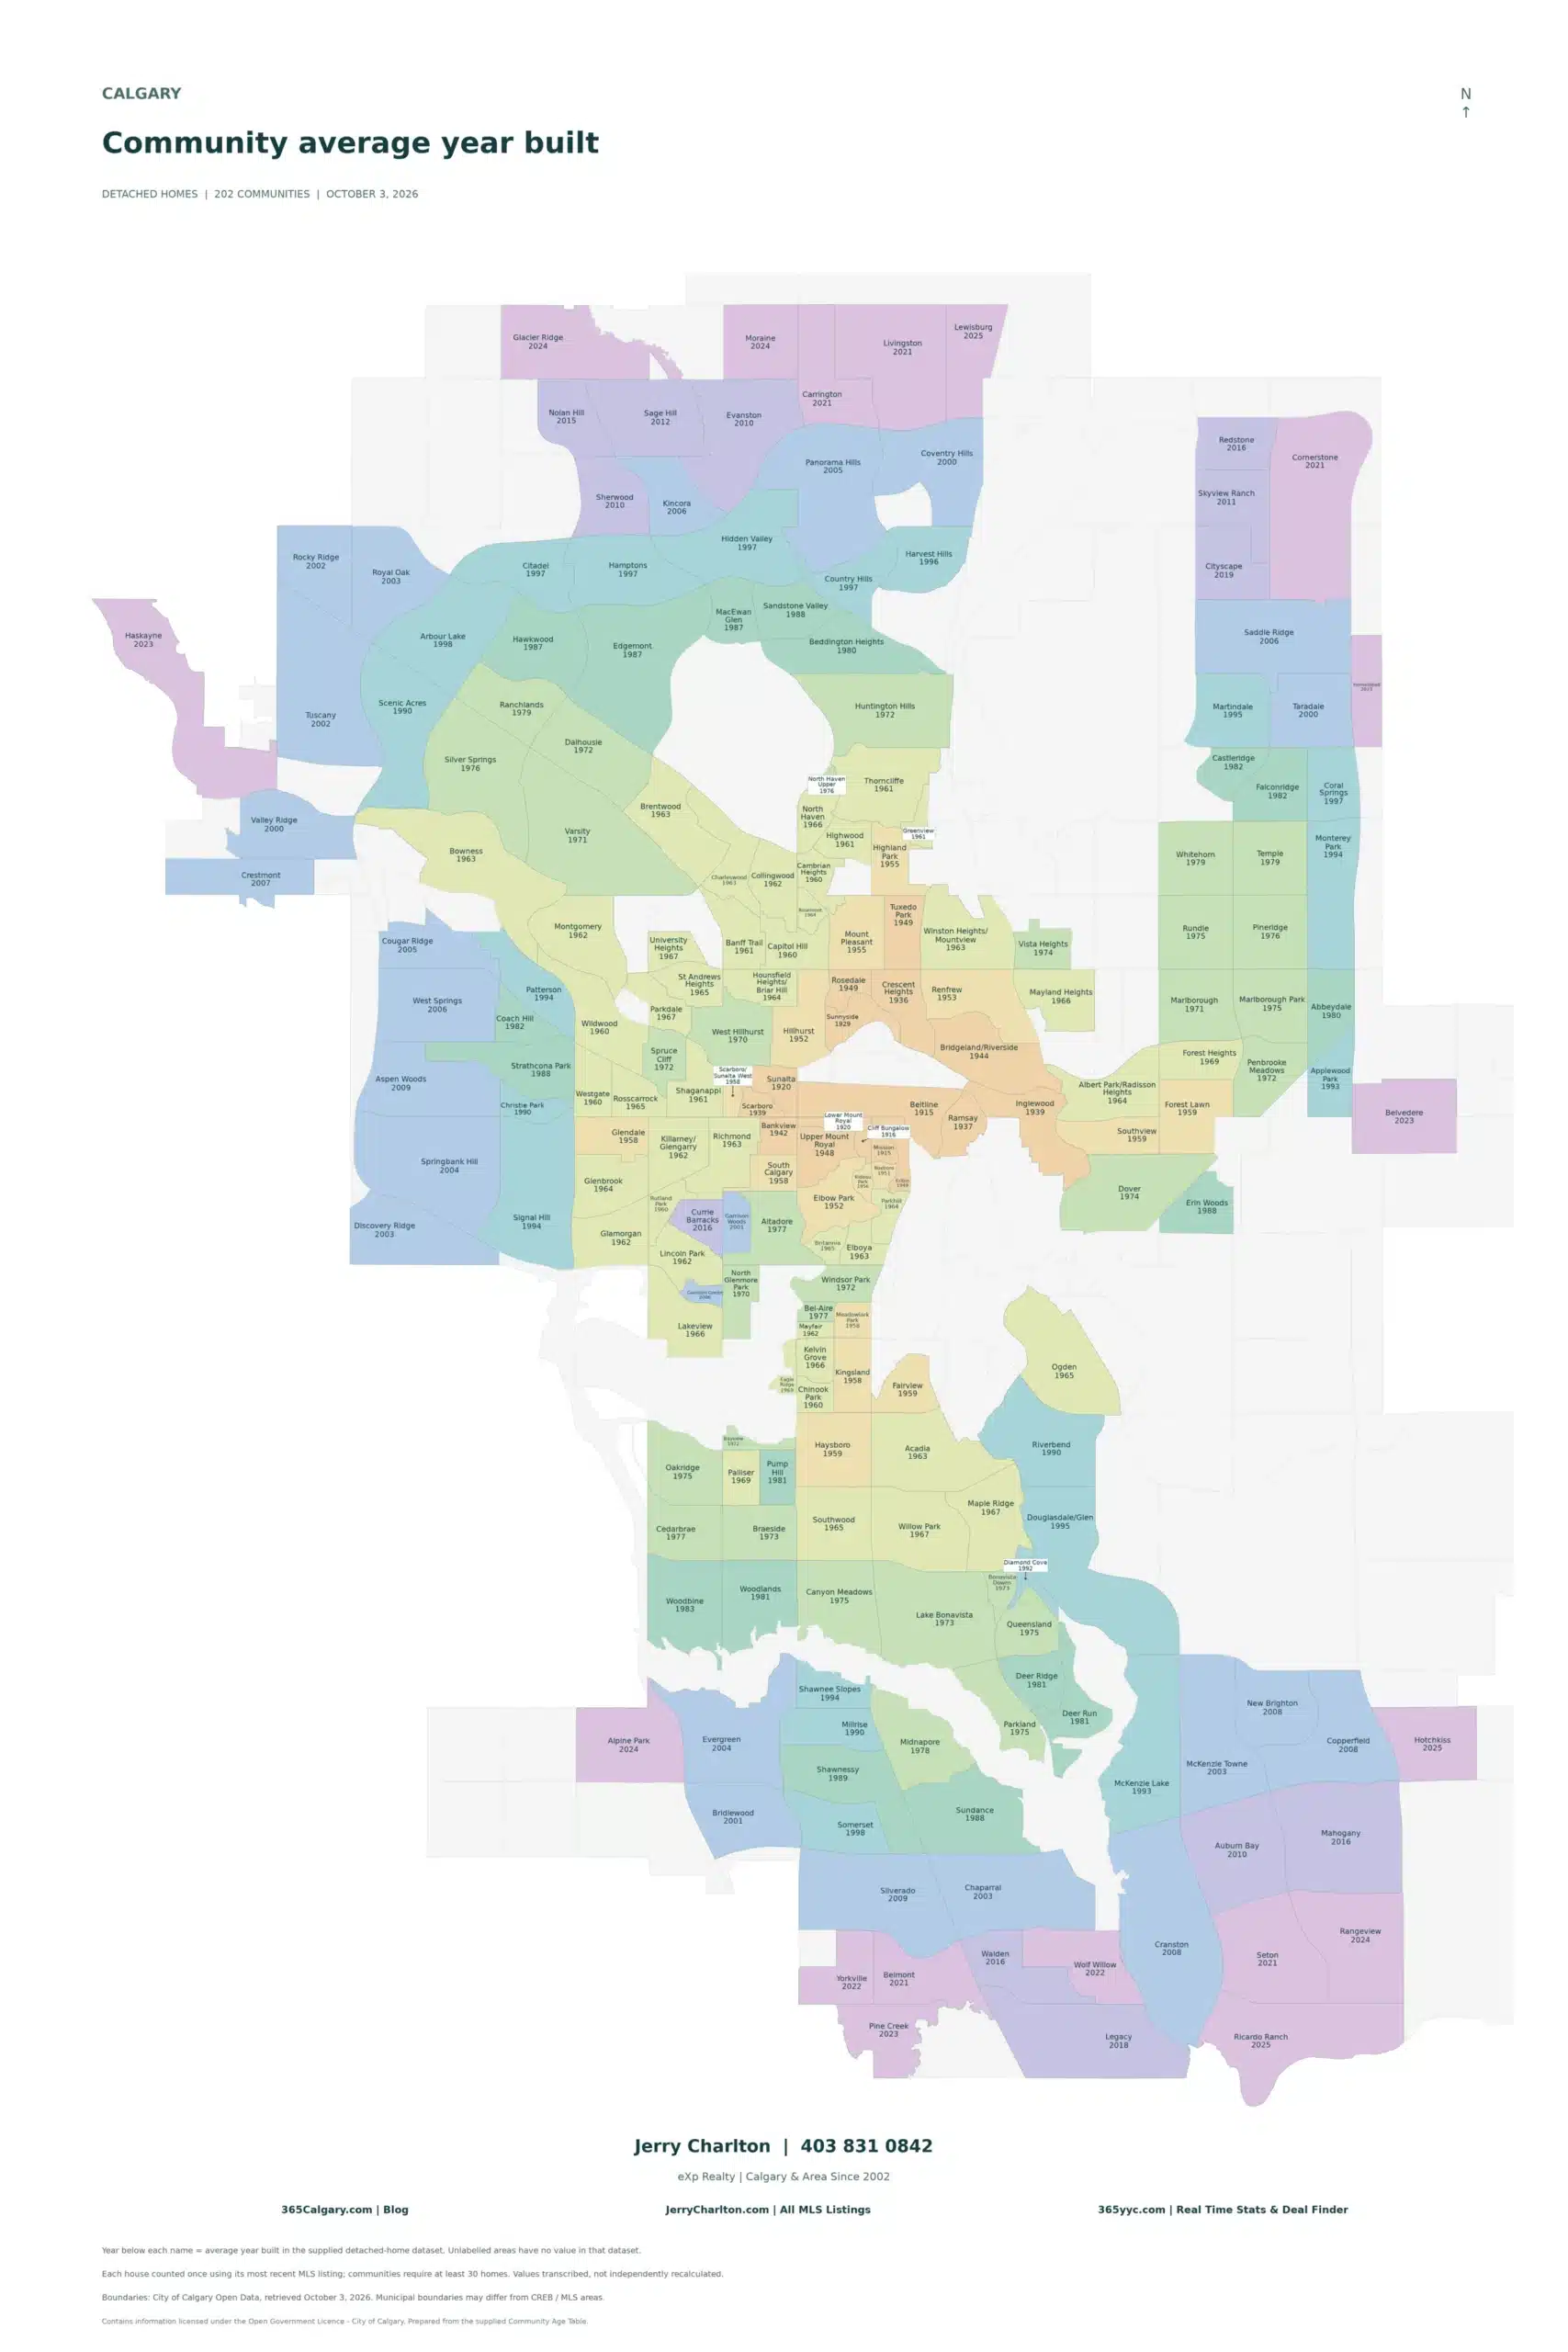
The dates on this map are a kind of housing “birthday”: the average construction year of the detached homes in my dataset. They aren’t the dates the communities were founded. That distinction matters, because a neighbourhood’s history can be much older than the homes standing in it today.
Start near the centre. Mission and Beltline both average 1915. Cliff Bungalow comes in at 1916, followed by Sunnyside at 1929. These numbers reveal an older generation of detached housing within a city that has continued building around it.
Beltline is a particularly useful reminder of what we’re looking at. Its 1915 average describes the detached homes included in this report. Its condominium towers tell another part of the neighbourhood’s story.
Move farther out and another generation takes shape. Brentwood and Acadia both average 1963. Varsity averages 1971, and Lake Bonavista 1973. Across the whole map, 45 communities have averages in the 1960s and another 31 in the 1970s. Together, those two decades account for more than a third of the 202 communities shown.
That’s a substantial part of the Calgary many people grew up in—and the Calgary many buyers are still discovering.
Some communities brought their own histories into the city. Forest Lawn joined Calgary in 1961, and Bowness followed in 1964. Calgary grew by absorbing established places as well as building new ones. Their averages on this map—1959 for Forest Lawn and 1963 for Bowness—are housing statistics, not the beginning of either community’s story. City of Calgary community planning history
Continue toward newer neighbourhoods and the calendar advances again. McKenzie Towne averages 2003. Mahogany averages 2016. Glacier Ridge, Alpine Park and Moraine average 2024. Hotchkiss, Lewisburg and Ricardo Ranch average 2025.
Those newest dates are an early snapshot. As more homes are completed and enter the dataset, their community averages can change. The map records a moment in an ongoing process.
Older communities keep changing, too. A new detached home built on an established street adds a recent construction year to an older neighbourhood. Over time, that mix can move the average forward. A community can have deep roots and a much younger housing average than you might expect.
That makes this map a useful starting point when exploring Calgary. Find your neighbourhood, then look at the communities around it. Which belong to the same generation? Where does the colour change? Which average surprises you?
For homebuyers, the year offers context. It can help guide questions about original construction, renovations and how much of a home has been updated. The condition of the individual property still needs its own careful look.
You’re welcome to download the map and link to this page. If you share a copy, please keep the contact footer and source notes attached so the next person can see where it came from and when it was prepared.
Every established neighbourhood was new once. Somewhere in Calgary today, someone is moving into a home that will become another family’s “older home” decades from now. The next version of this map is already taking shape.
About the map: October 3, 2026 data covering 237,982 detached homes across 202 communities. Each house is counted once using its most recent MLS listing in the dataset; communities require at least 30 homes. These are sample averages, not a census of every home. Geographic boundaries come from the City of Calgary and may differ from MLS community boundaries.
Jerry Charlton
403 831 0842
eXp Realty | Calgary & Area Since 2002
365Calgary.com | Blog
JerryCharlton.com | All MLS Listings
365yyc.com | Real Time Stats & Deal Finder
Leave a Reply